
News
From our latest research publications to insightful, thought-provoking blogs, keep informed and engaged with the latest updates from UBDC.
.svg)
.svg)
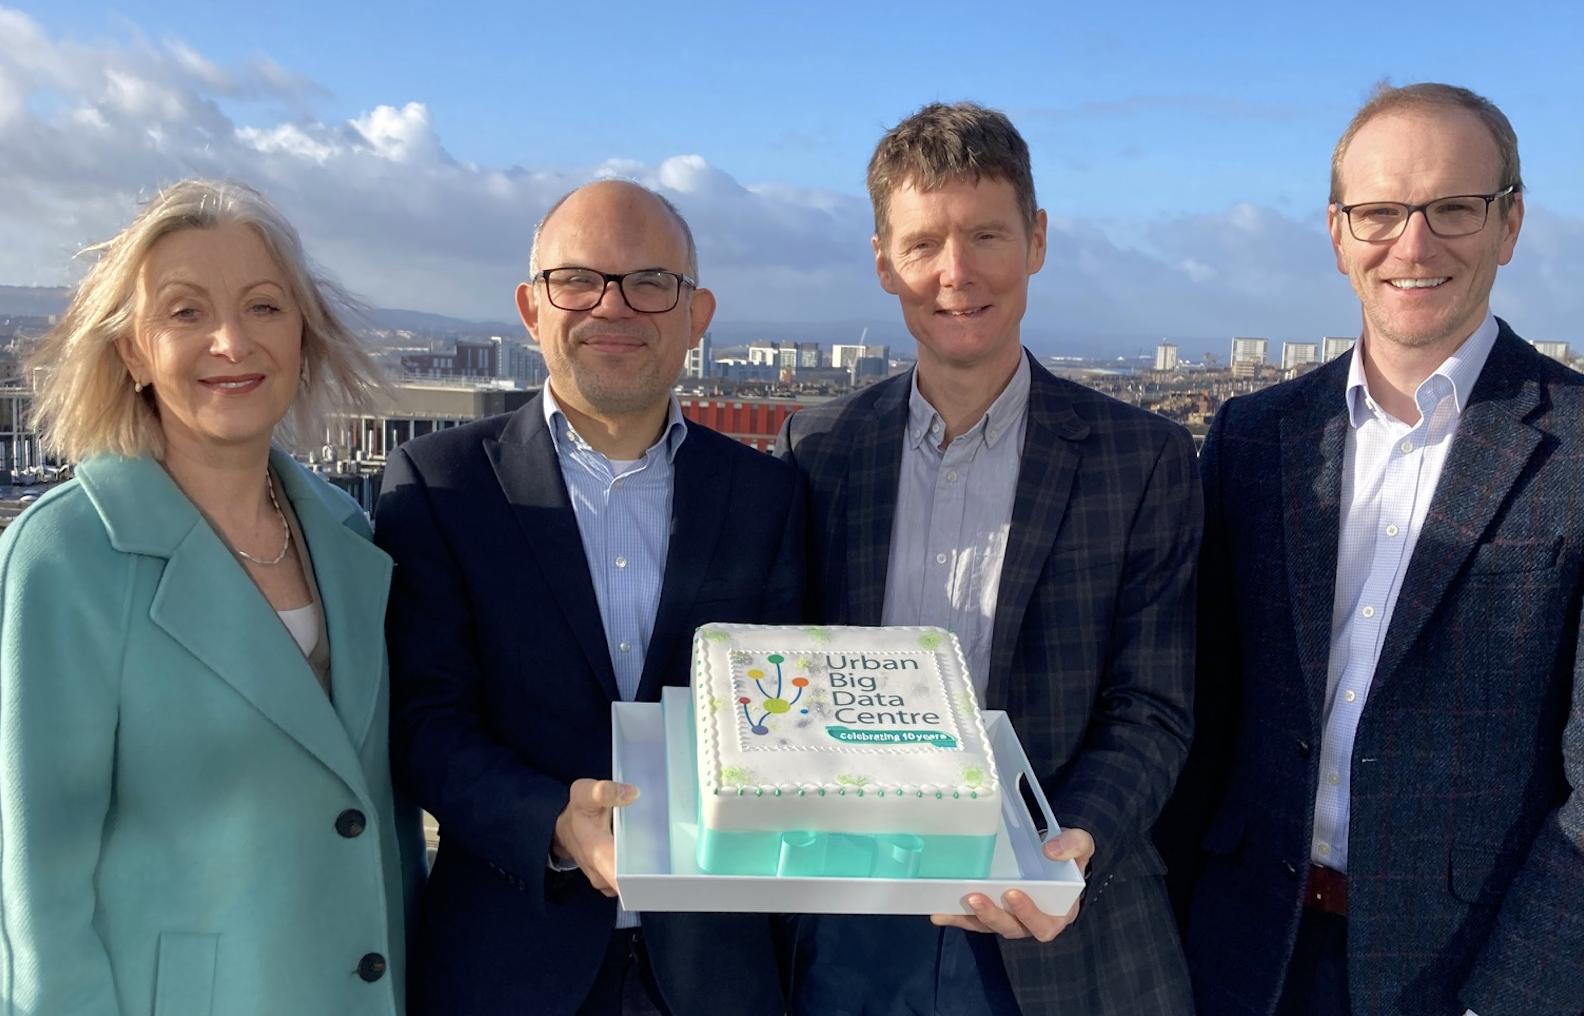
Urban Big Data Centre celebrates its 10th Anniversary
The Urban Big Data Centre (UBDC) celebrates its 10th anniversary in 2024

The Glasgow CCTV Object Detection project
The Glasgow CCTV Object Detection platform aims to improve public understanding of mobility and traffic patterns across Glasgow.
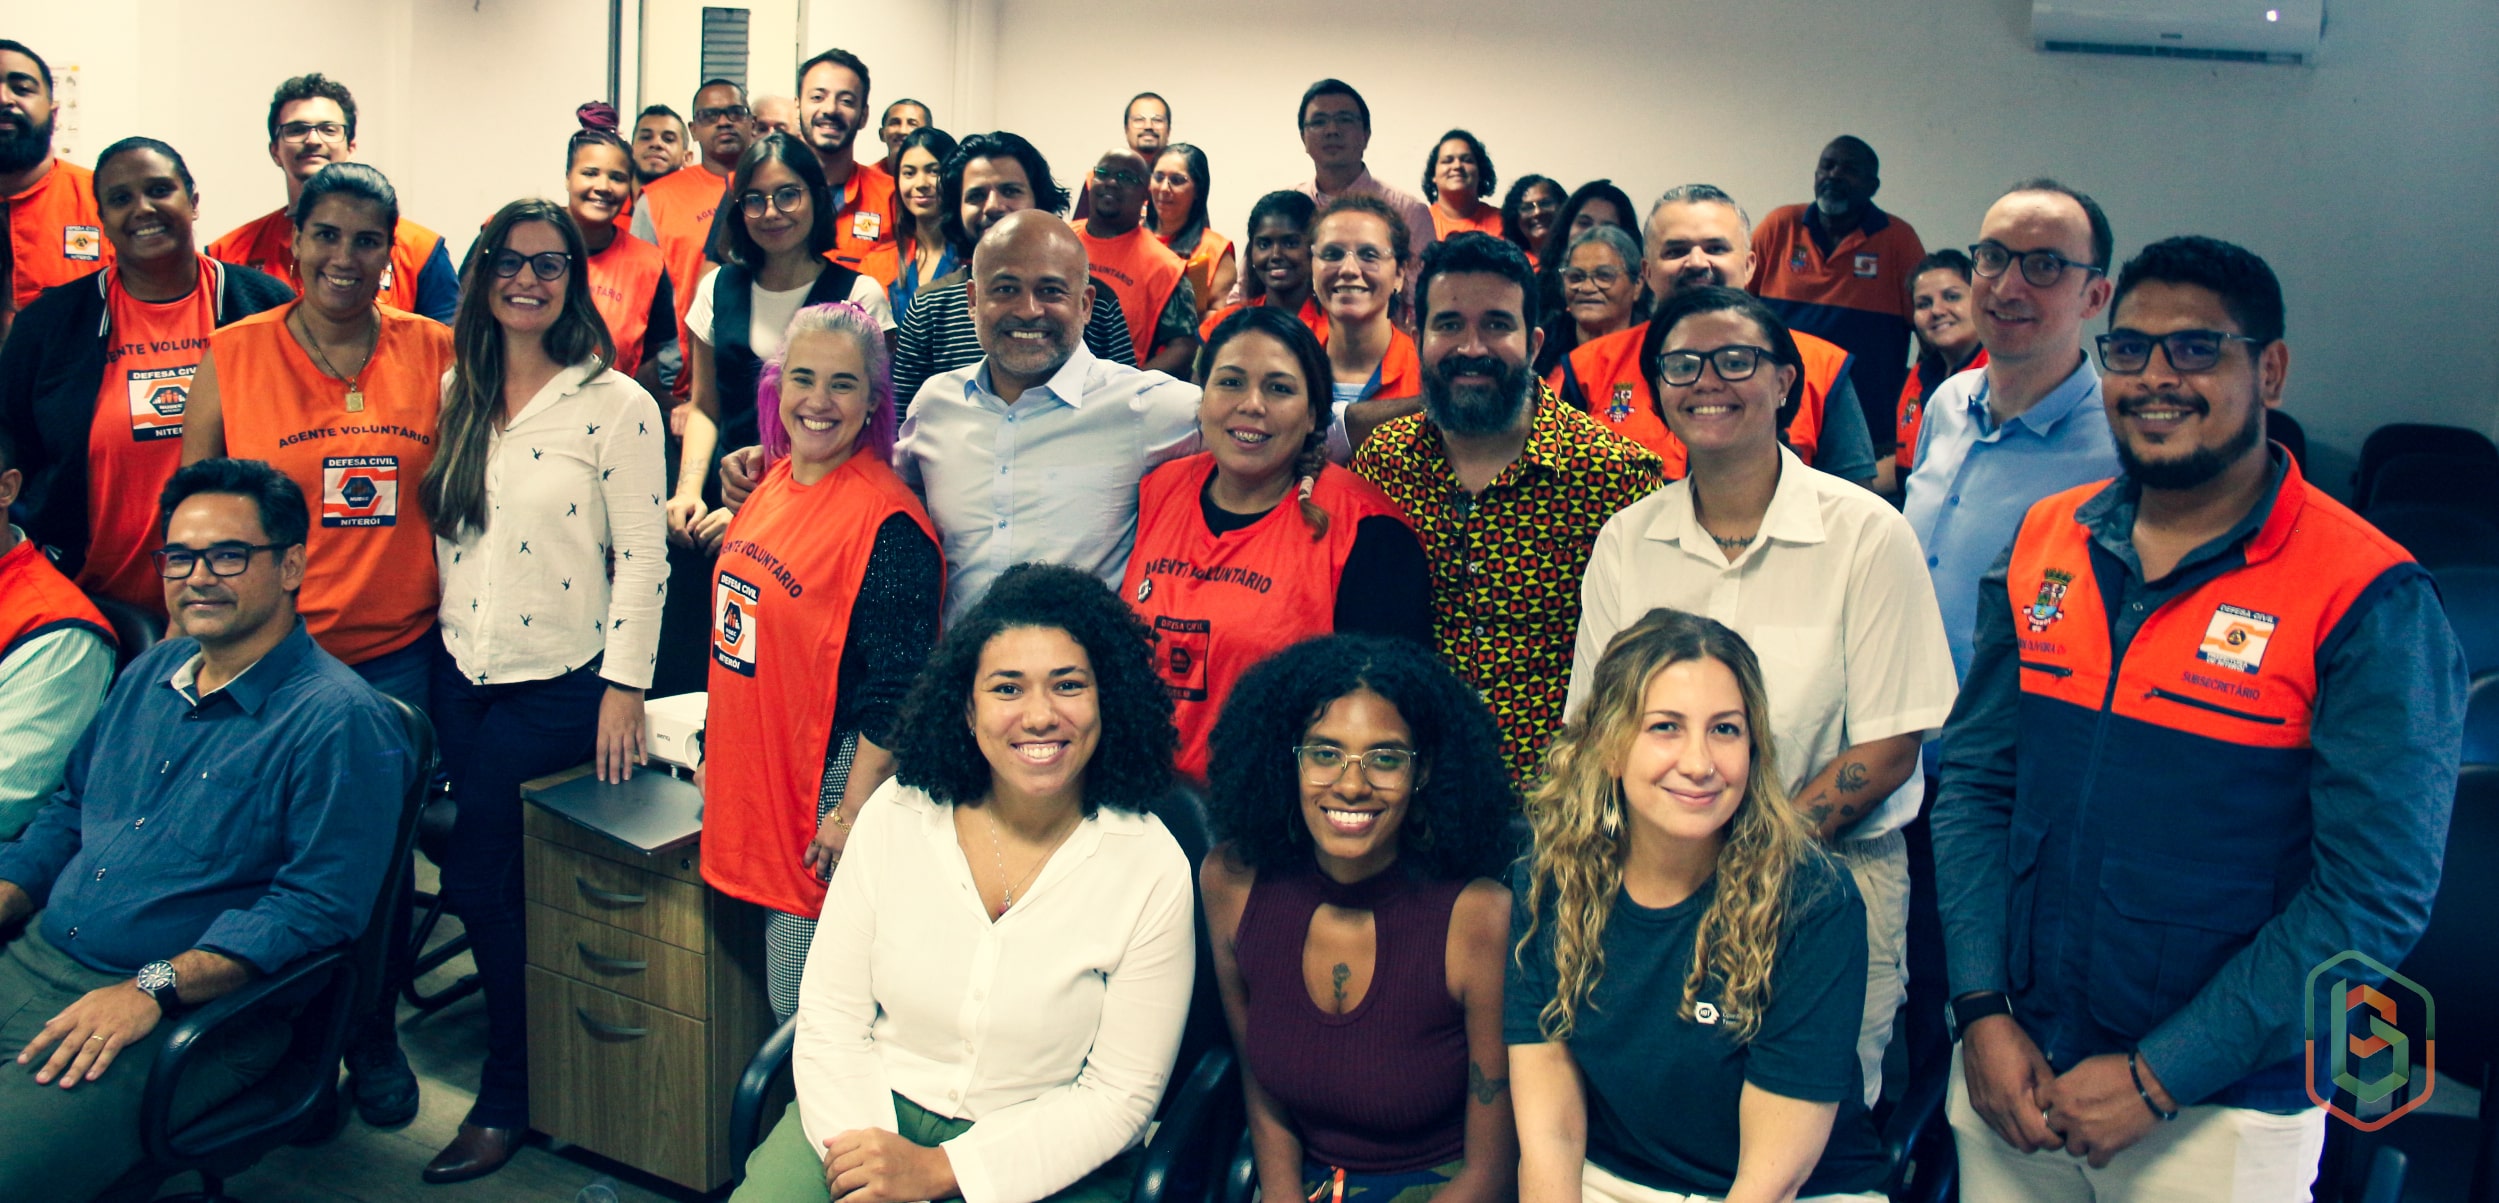
DataCivil’s PI discusses Disaster Risk Reduction
DataCivil’s principal investigator, Philipp Ulbrich participated in a panel discussion for the launch of the Municipal Plan for Disaster Risk Reduction in Niterói, Rio de Janeiro state.
Urban Big Data Centre celebrates its 10th Anniversary
The Urban Big Data Centre (UBDC) celebrated its 10th anniversary on 29 January 2024. Funded by the Economic and Social Research Council and the University of Glasgow, UBDC is a dynamic research hub and national data service, championing the use of smart data to inform policymaking and enhance the quality of urban life.

Introducing the Adzuna teaching dataset
UBDC are excited to announce the launch of ‘Adzuna Teaching’, a small and random subset of our main Adzuna dataset. Adzuna Teaching makes Adzuna accessible to a wider audience, specifically students undertaking research projects and lecturers interested in employment or Smart Data. It will also be of interest to researchers thinking of applying for the full Adzuna dataset. Adzuna Teaching preserves the structure, and contains all variables, of our main Adzuna dataset. It therefore includes detailed information on salary, occupation, sector, seniority, skills, location, and job descriptions. See our Adzuna metadata for all variables included. The dataset represents a random 20,000 subsample of all (deduplicated) UK adverts posted on Adzuna.co.uk in the month of September 2021.
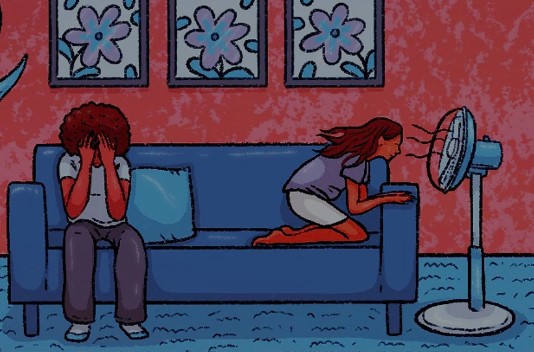
Sensor-enhanced housing survey for urban heat investigation
The collaboration between UBDC Urban Sensing & Analytics team and The Bureau of Investigative Journalism (TBIJ) originated from a small pilot study carried out by UBDC in the winter of 2021, supported by ESRC.
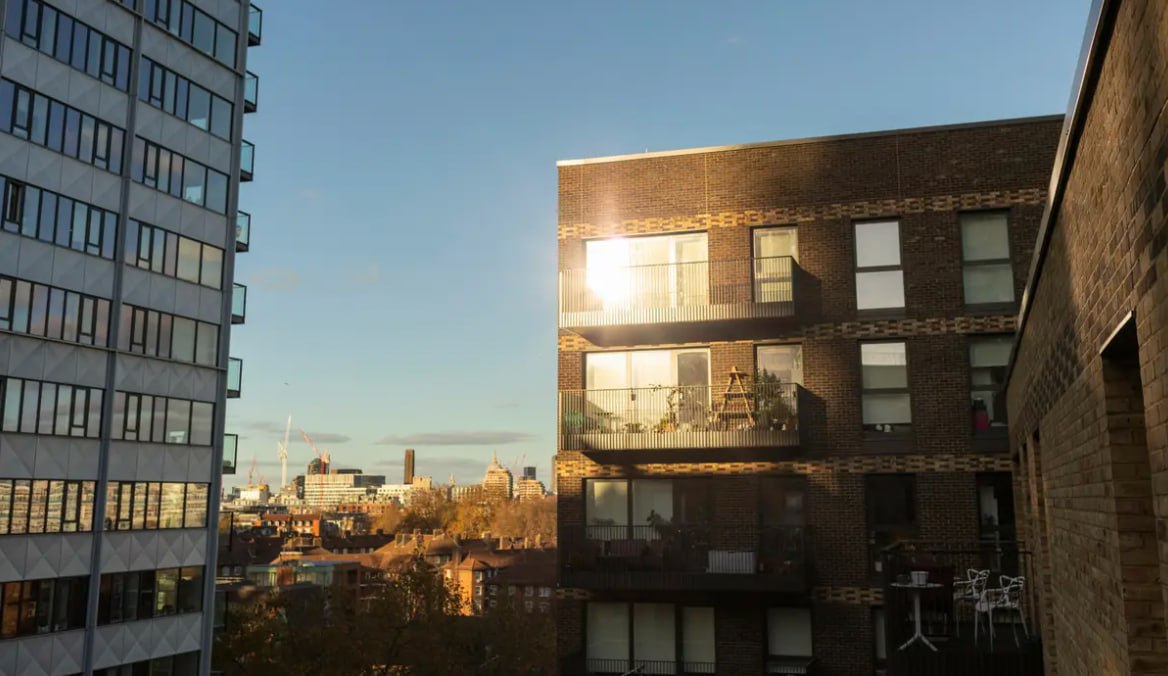
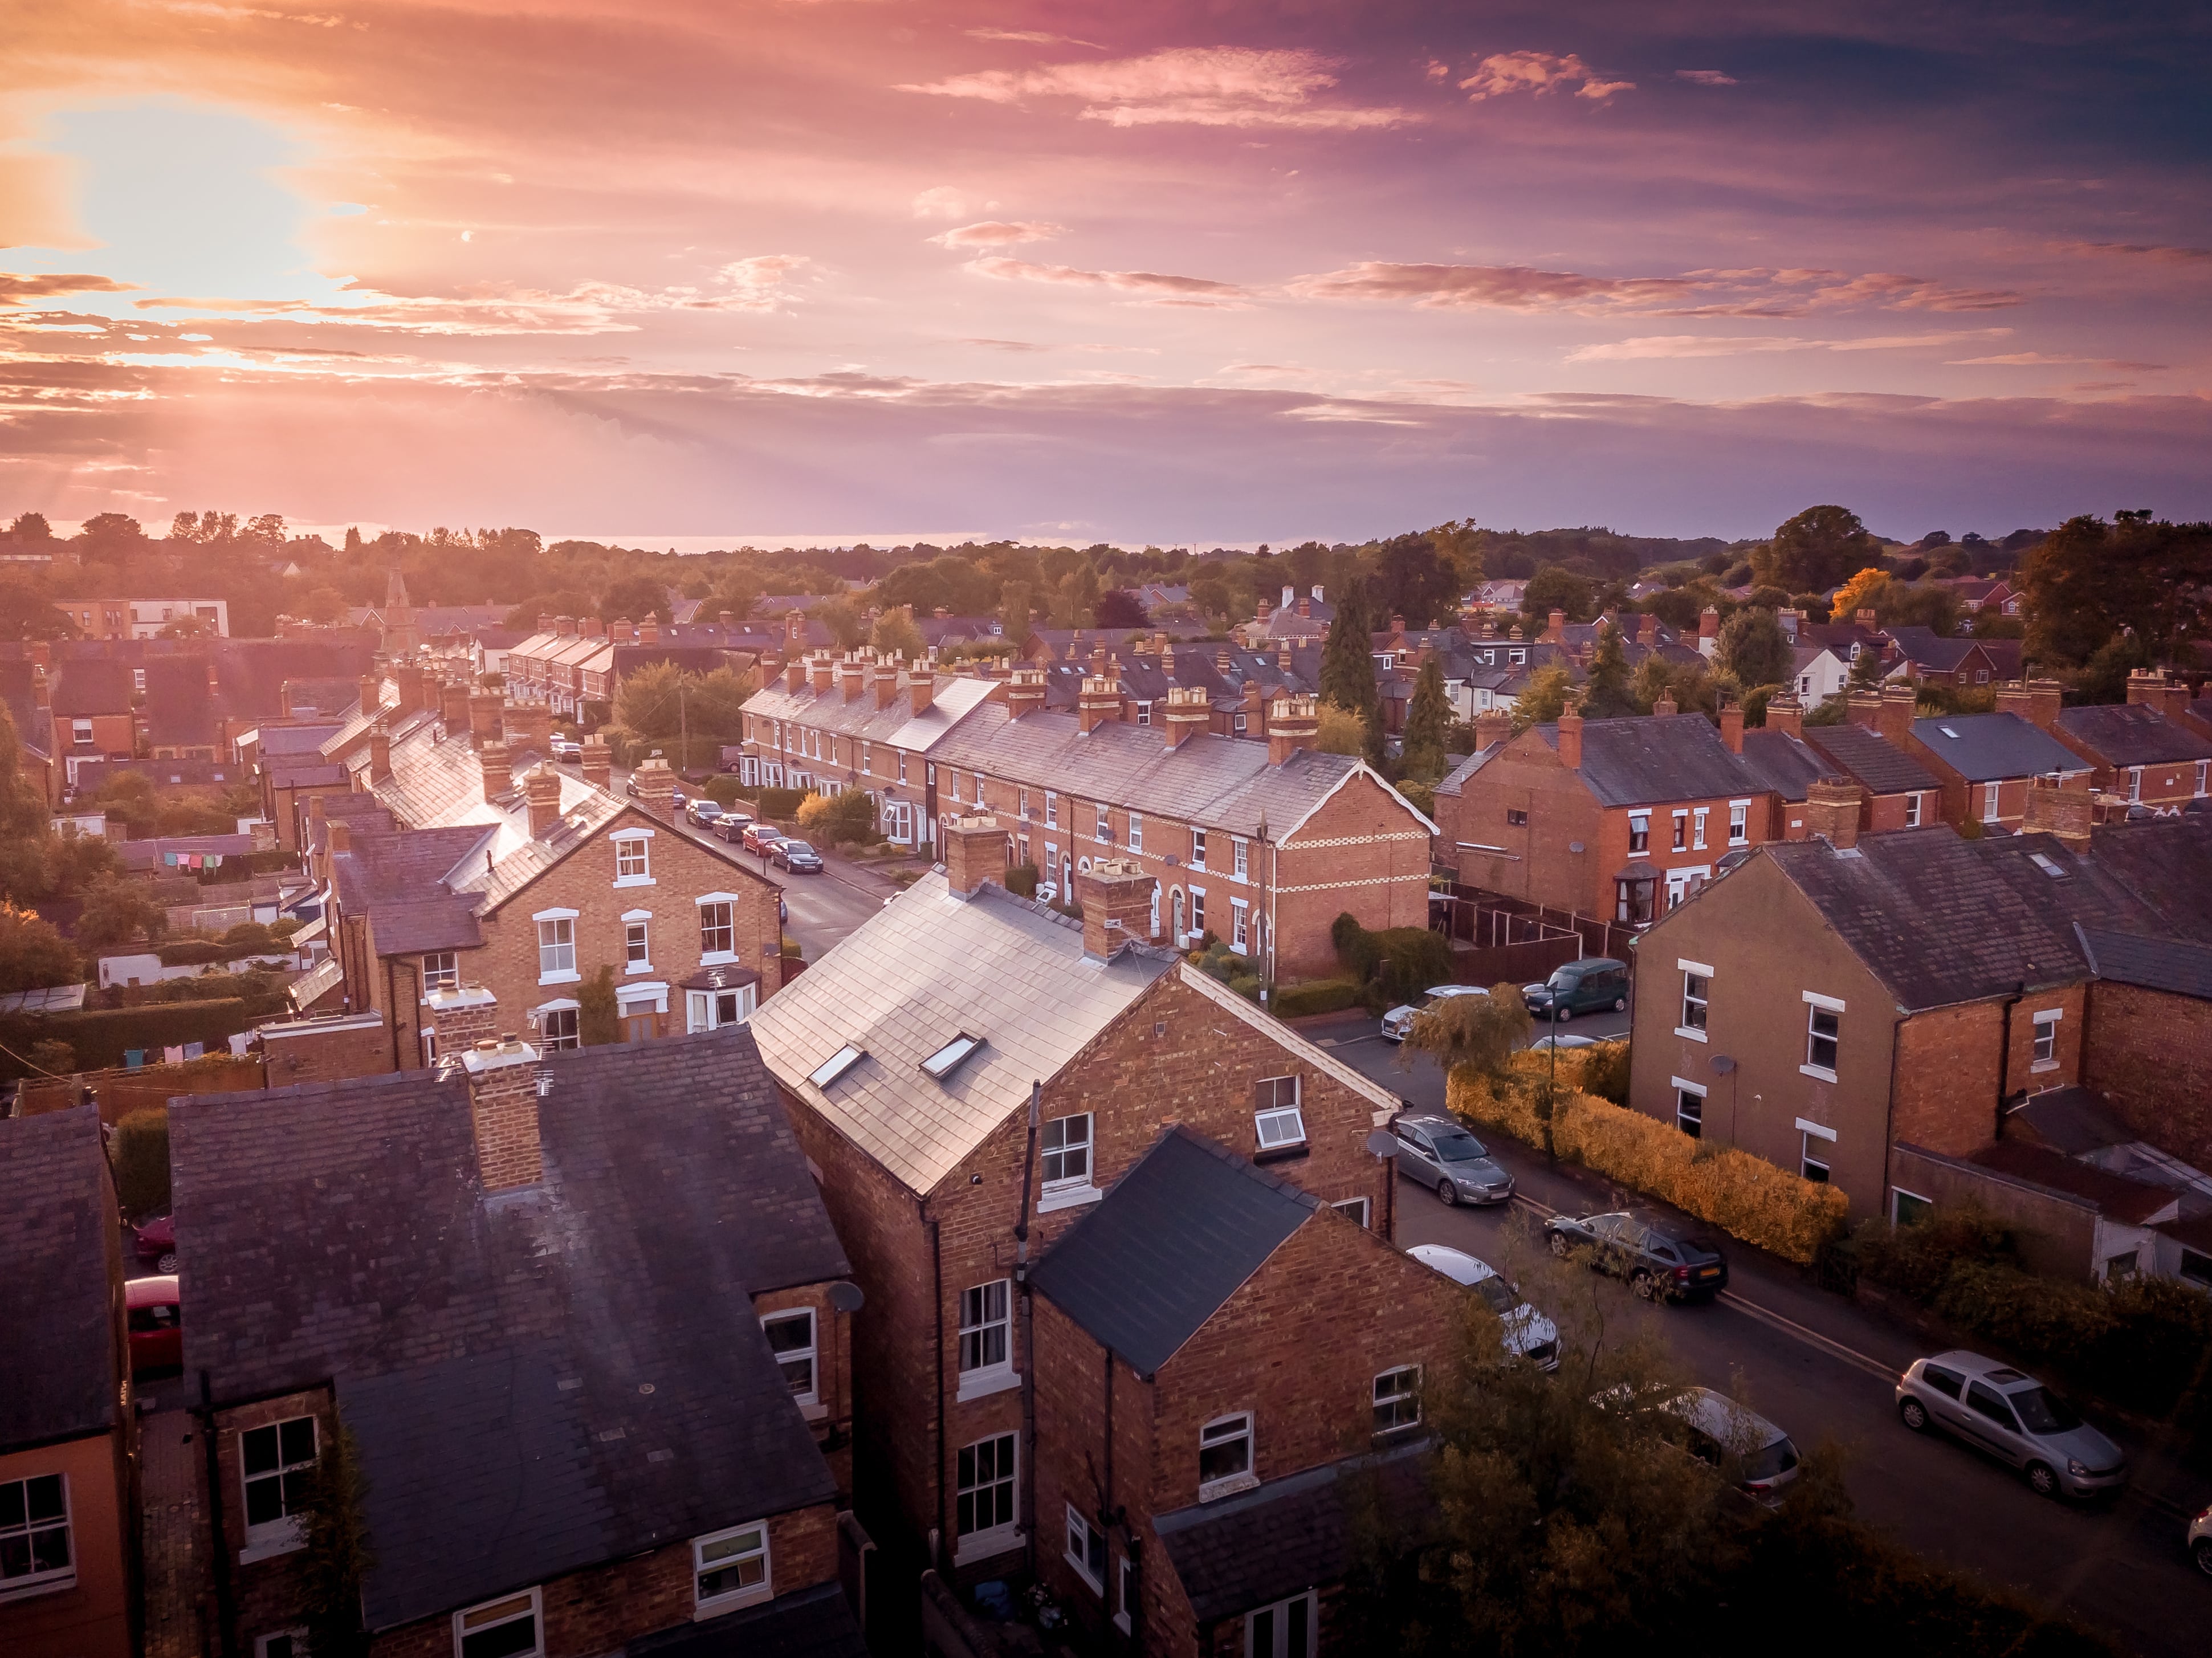
UBDC data analysis reveals concern for the UK's overheating homes
UBDC data analysis reveals concern for the UK's overheating homes
Waterproofing Data project wins ESRC Celebrating Impact award
An UBDC project that’s increasing community resilience of flood-prone areas in Brazil has won an ESRC Celebrating Impact Prize.
Are short-term rental regulations impacting Airbnb listings?
Airbnb, the biggest player in the online ‘home-sharing’ world, is running a 2023 ad campaign to encourage more people to rent out their homes or rooms for some extra cash. This comes at the same time that the Scottish Government has put in place new regulations for the sector.
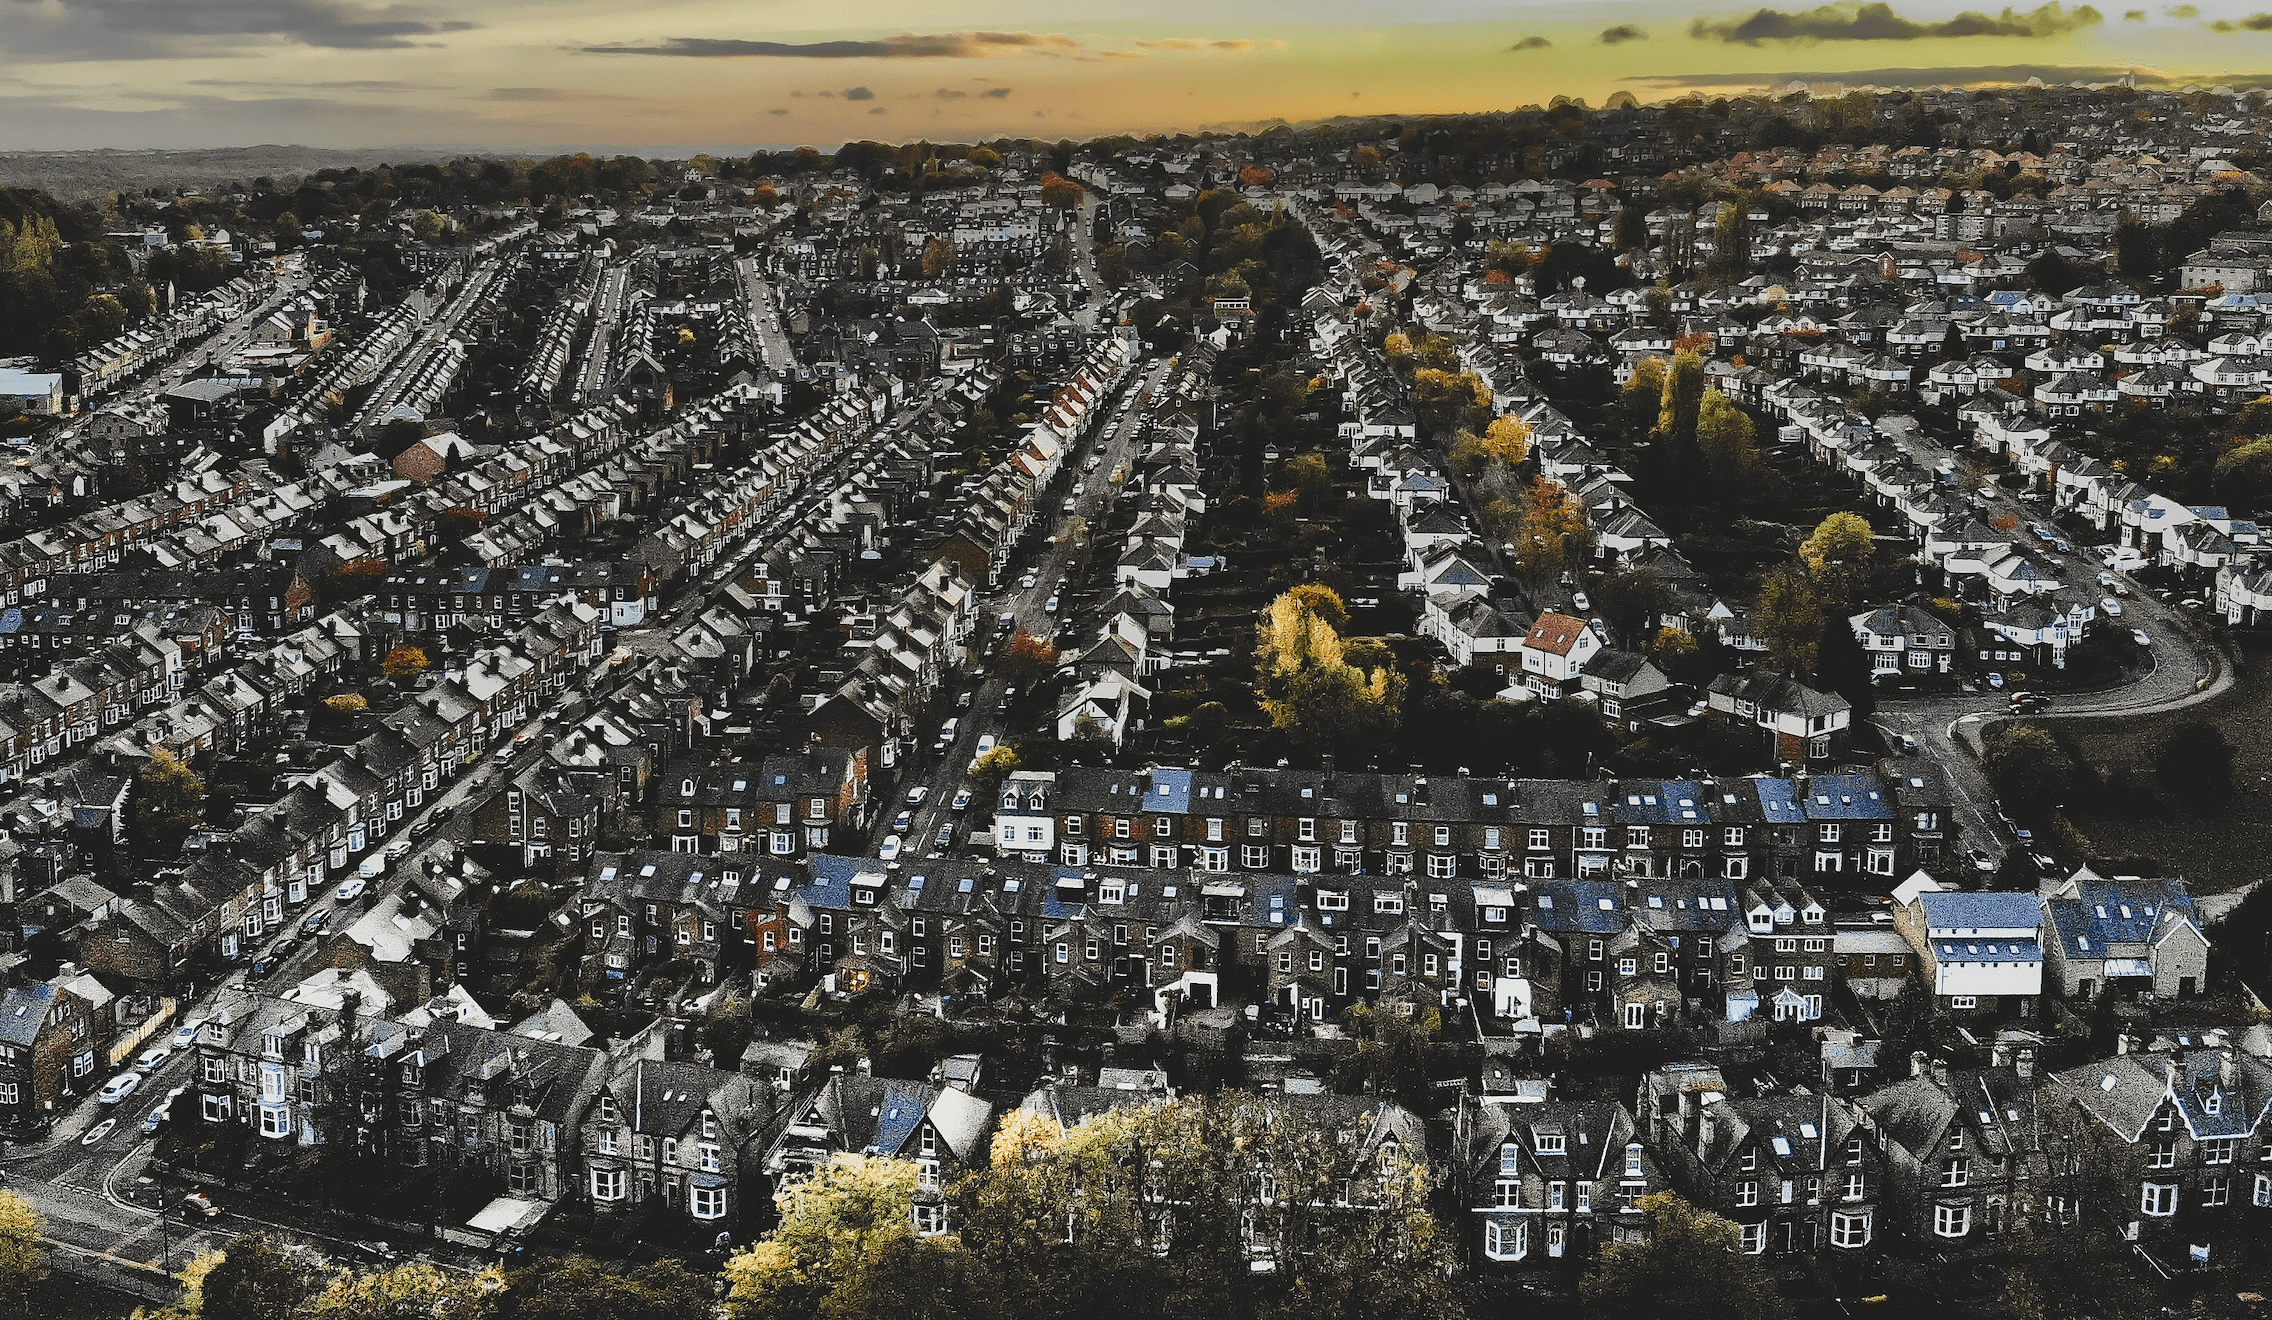
Private renting and the suburbanisation of poverty
One of the most marked changes in the UK’s housing system over the last 30 years has been the rise of the private rented sector (PRS). Many more low-income households now find homes in this sector.
.svg)
UBDC Newsletter
Subscribe to our quarterly newsletter for all our latest news, events and data updates.
Jointly Funded By


