Did safe cycling infrastructure still matter during lockdown?
During the lockdown, the UK government introduced strict measures to slow the spread of COVID-19 by limiting people’s movement. This led to substantial reductions in traffic, making roads much safer for cyclists.
In this blog, Dr Jinhyun Hong, Dr David McArthur and Dr Varun Raturi share the findings from their new publication in Sustainability, which examines the role played by safe cycling infrastructure during the lockdown period.
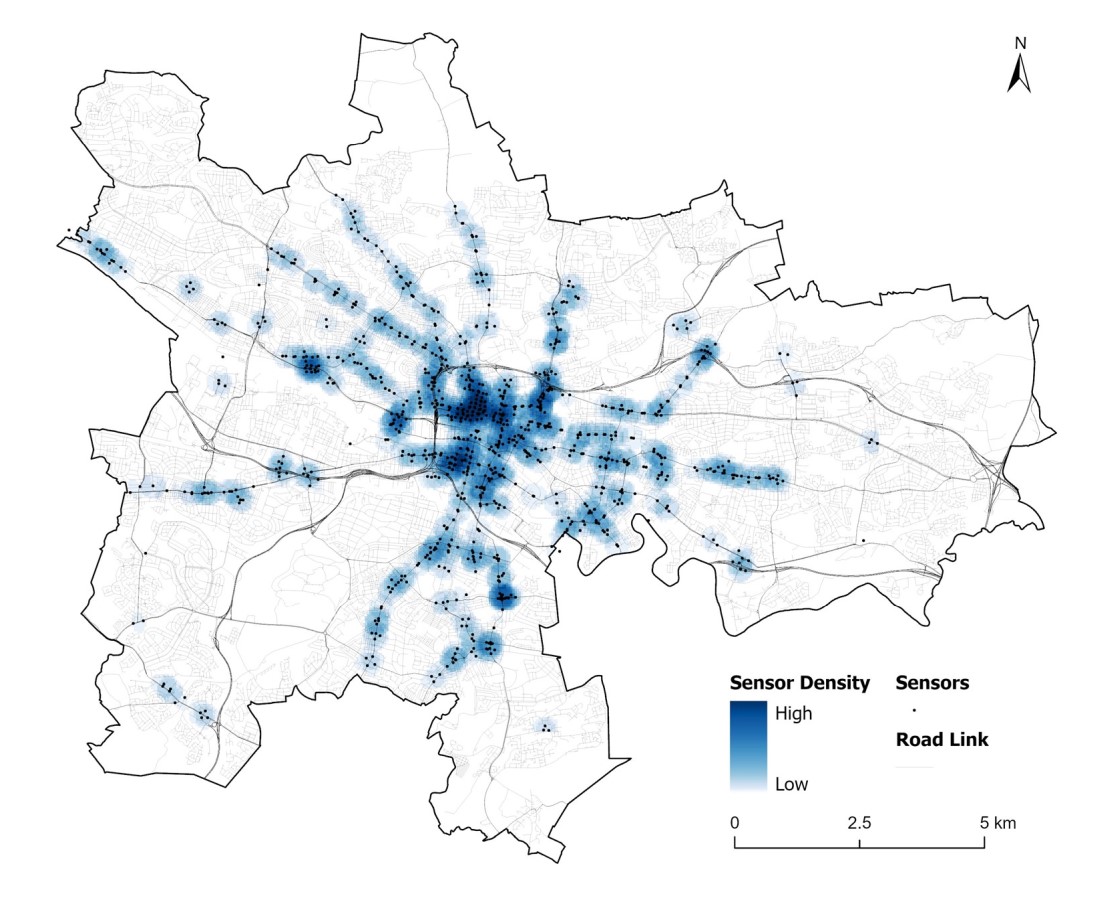
One of the main barriers to people cycling is safety concerns. Therefore, many UK cities have provided cycling infrastructure to address these concerns and encourage more people to cycle. However, access to safe cycling infrastructure varies across neighbourhoods, potentially contributing to inequality. In Glasgow, as we can see in the map below, there are fewer safe cycling lanes (e.g., Shared off road, Segregated lanes) in neighbourhoods located in the east side of Glasgow (where levels of deprivation tend to be higher).

Figure 1: Cycling infrastructure in Glasgow. View image full size.
In March, the UK entered a national lockdown to slow the spread of COVID-19. This led to substantial reductions in traffic, making roads much safer for cyclists. This raises the question of whether people cycled relatively more on typical roads during the lockdown compared to safe cycling lanes. As seen in the map, safe cycling lanes are often connected to amenities (e.g., rivers, parks etc.), potentially attracting cyclists even if the infrastructure confers no additional safety benefit. If cycling infrastructure remained busy during this period, it may indicate that it is the connectivity of the infrastructure that drives its use rather than the safety benefits alone.
We utilised crowdsourced cycling data collected from the activity-tracking app Strava from July 2019 to March 2020 to examine the extent to which cycling intensity for non-commuting purposes increases according to the different types of cycling infrastructure. Firstly, we calculated the moving average of cycling intensity according to different types of cycling infrastructure. As shown in Figure 2, there were significant increases in cycling intensity after requests by the government for people to work from home and then from the implementation of the lockdown, especially on the safe cycling infrastructure except for segregated lanes. This exception could be due to most of these lanes being located around city centre areas where the majority of jobs are based. During the lockdown, only essential workers could work outside of their homes, potentially reducing the use of these safe cycling lanes. Interestingly, we can see that the cycling intensity also increased on typical roads (‘Nothing on road’), potentially reflecting the improved level of safety.

Figure 2: Seven-day moving average cycling intensity for non-commuting trips across infrastructure types. View image full size.
Secondly, we found that two government interventions (i.e., ‘Work from home’ and ‘Lockdown’) had positive impacts on non-commuting cycling intensity for most types of cycling infrastructure (even for typical roads) by using regression models. Typical roads became substantially less busy, making them more attractive to even less experienced cyclists and implying that safety should be the policy target.
However, we also found that there are relatively higher increases in cycling intensity on ‘Demarcation on road’ (e.g. painted cycle lanes on roads), ‘Park Route off road’ (e.g. a cycle lane in a park) and ‘Shared off road’ (e.g. footways that have been designated as a shared space for cycling and walking) compared to typical roads (see our paper for detailed information). This shows that safe cycling infrastructure still mattered during the lockdown and the unequal distribution of this infrastructure could result in unequal health benefits across areas in a city.
Thirdly, we calculated average cycling distances per road segment between March 1st and 15th (pre-restrictions), 16th and 22nd (people requested to work from home) and 23rd and 31st (full lockdown). Then, we calculated differences after ‘Work from home’ and ‘Lockdown’ compared to pre-restrictions. Figure 3 shows six selected places with high increases in average cycling distance after the lockdown. We can see that there were higher increases in non-commuting cycling activities on roads that have good amenities, such as rivers and parks, or connect to places such as supermarkets. This was even true for typical roads with no cycling infrastructure. These findings imply that consideration should be given to amenities and connections to attractions when building any new cycling infrastructure.
Since safe cycling lanes are not equally accessible for people from different neighbourhoods, providing temporary cycling lanes during the pandemic considering these conditions could encourage people to cycle more and, in turn, improve the health and wellbeing of the city’s inhabitants.

Figure 3: 6 selected places with high increases in average cycling distance after the lockdown (Google Street View images). View image full size.