blog | 06.05.2020 |

Understanding the impacts of COVID-19 on the Glasgow City Region economy – gauging impacts through big data?

In this blog, which is reposted from the Policy Scotland website, Dr David Waite from Policy Scotland and UBDC's Dr David McArthur examine the economic impacts of COVID-19 in the Glasgow City Region & explore the potential for using local big data to fill the gaps in our understanding.

COVID-19 is a public health emergency with economic implications presenting few precedents. To minimise stresses on health services, the economy has effectively been shut down, whilst to avoid widespread “economic scar tissue” emerging, that is, long-term damage to the economy – massive fiscal responses have been put in place to support firms and workers. Suddenly the state looms large in the economy in a very big way.

The outlook for the UK economy in the short term is bleak. Office for Budget Responsibility (OBR) projections point to a GDP dip of 35% (for Q2 2020), with rising public debt. GDP projections from the Scottish Government suggest a 33% dip. Of course, such projections reflect more speculation than anything certain at this point. Impacts on the labour market will, in many ways, hinge on the efficacy of the policy responses. To date, however, we can observe 1.4 million claimants for Universal Credit in the four weeks of the crisis to 20 April. Searches for “universal credit” on Google reached an all-time high just prior to the lockdown.

Graph showing relative search volume for the term “universal credit”. The maximum all-time search volume = 100. The y axis shows Relative volume going up from 0 to 25, to 50 and 100.  the x axis shows months from January 2020, and including February, March and April. Search volume is around 40 to 45 until about the second week in March when there is a sharp rise to 100 to just before when lockdown was imposed – illustrated by a vertical dashed red line. From lockdown the volume decreases in late March and the first half of April to about 63.

Source: Google Trends. Data plotted by UBDC.

Beyond the aggregate level, clear fault lines in the UK’s economy can be pointed to. First, there is cause to believe that younger participants in the labour market may be the most exposed to the downturn given their sectoral and wage profiles; indeed, what are the prospects now for new graduates looking to enter into the labour market?; others, meanwhile, suggest shocks may be more accentuated for female workers (Queisser et al and Hastings). Office for National Statistics data also suggests that the ability to work from home favours those in higher occupational categories and those boasting higher skills. Additionally, evidence is reasonably clear that some of the essential activities ongoing at the moment – such as social care – rely on a workforce exhibiting low wages and stark precarity. As the US philosopher Michael Sandel has noted in the New York Times recently:

Beyond thanking them for their service, we should reconfigure our economy and society to accord such workers the compensation and recognition that reflects the true value of their contributions — not only in an emergency but in our everyday lives. Michael J. Sandel
The New York Times, 13 April 2020

We also need to ask questions about how the economic consequences will play out sub-nationally. With a concern for the Glasgow City Region – and reminded of past evidence which showed a weaker (relative) resilience to economic shocks (Champion and Townsend (subscription required) and Clarke/Resolution Foundation) – what implications will COVID-19 have in this context? Here we run into data constraints quickly. As a starting point, however, one way to consider urban economy impacts is to use Michael Storper’s broad framing of the urban growth system as hinging on the interactions between specialisations, human capital and institutions.

In terms of the former, initial analyses point to forms of sectoral exposure for local economies, and with suggestions about how sectors will be differentially impacted by the lockdown. For instance, in some areas such as leisure and tourism activities will drop significantly. As an example, the number of reviews being posted in Airbnb has dropped sharply in both Glasgow and Edinburgh, indicating a potential collapse in revenue in the tourism industry.

A series for graphs for Edinburgh and Glasgow showing the number of Airbnb reviews per week from weeks 0 to 17 of each year from 2016 to 2020. The weeks are shown on the x axis. The y axis plots numbers of reviews. First row is Edinburgh. In 2016 reviews rise from approx. 500 to approx. 1000. In 2017 reviews are between approx. 600 to approx. 2100. In 2018 reviews are between approx. 900 to approx. 3800. In 2019 reviews are between approx. 1100 to approx. 5,300. In 2020 reviews are around 2000 until week 5 and then drop to almost 0 by week 13 and then lower by week 17.
Second row is Greater Glasgow. In 2016 reviews rise from approx. 90 to approx. 300. In 2017 reviews are between approx. 150 to approx. 550. In 2018 reviews are between approx. 200 to approx. 1200. In 2019 reviews are between approx. 300 to approx. 1300. In 2020 reviews are just over 400 at the start of the year rising to almost 1000 in until week 7 and then drop to under 200 by week 13 and to 0 by week 17.

Source: Airbnb website. Plotted by UBDC. Permission to use for research purposes only.

Approaches taken by the Centre for Cities (which also factors in export orientations) and the Centre for Progressive Policy, suggest that Glasgow may follow similar trajectories to UK-wide projections. Questions here about the ability of workers to move from impacted functions or industries, to less impacted or growing functions and industries are also pertinent. Glasgow is also a city with a notable higher education sector, so the challenges facing this sector, particularly in terms of future admissions, will be an issue of wider regional consequence.

In terms of human capital, we are aware of anecdotal evidence from Scottish Enterprise that some apprentices have been furloughed, whilst questions about the prospects of some self-employed in the labour market can be pointed to. Across the eight local authorities in the City Region, Annual Population Survey data suggests shares of self-employment are above and below the Scottish average, however, see Overman’s cautionary stance about what relative shares may tell us. We also know that dislocations from the labour market, for young people in particular, can lead to an individual’s labour market prospects being scarred (subscription required). UBDC colleagues are currently processing data from employment search engines, which should provide interesting perspectives on the nature of the recovery. We may also want to consider impacts on personal wellbeing, which recent ONS data from the Opinions and Lifestyle Survey gives some view on (for the UK).

In terms of institutions, if we conceive of this broadly, we turn to consider the government responses to mitigate the crisis but also considerations regarding the social fabric that will emerge at the end of the crisis. That is, important questions may be posed about what social institutions will be in place to support those hit by the crisis; indeed, what capacity will there be in the third sector to support greater need? Additionally, how will housing market challenges emerge? The Resolution Foundation points to the greater tendency for private renters to work in shutdown sectors compared with home owners, for example. For the latter group, what will be the impact of mortgage relief measures? Across the policy spectrum, the state and the market are being reconfigured in striking new ways in just a matter of weeks.

In general though, despite the aforementioned areas being critical to our understand of how urban economies work, data on local contexts is unfortunately constrained (and often lagged). In looking to address this, we need to distinguish what data may expose in terms of: one, what is the nature of the shock and the drop-offs in economic activities; and, two, what is it telling us about the economic recovery after public health measures are taken away or relaxed. That is, viewing the urban economy under lockdown, and viewing the urban economy coming out of lockdown.

If agglomeration economies are characterised, in normal times, by the velocity of interactions within dense or large spaces, transport data is clearly one lens to look through to observe impacts. Here we can turn to a number of sources. First Google mobility reports, drawn out for local authority areas, gives an indication of transport for various uses/purposes, such as “retail and recreation” and “workplace”. The April 11 report for Glasgow City shows a sharp decline in activity relative to a baseline week in January (-84% and -61% respectively). An interesting issue here, will be to what extent such data gives us a picture of the recovery; will we return back to pre-crisis levels?

Counts derived from CCTV cameras in the city centre of Glasgow have shown a sharp drop in both pedestrians and cars. There has, however, been a slight tendency in the past week for the number of cars to increase.

Graph showing relative activity volume of cars and pedestrians in Glasgow city centre derived from CCTV cameras/ the y axis shows the volume relative to Monday 24 February starting at 0% and going up to 120%. The x axis shows weeks from 24 February 2020 to 27 April. Cars are illustrated with an orange line and pedestrians with a jade line. There is generally greater activity volume from cars but the two lines largely mirror each other. Car volume rises at the start of the weeks 24 February, 2 March and 9 March to over 120% and then drops during the week to 95%, then 85% on the first two weekends. Pedestrian volume is 110%, 120% and 110% at the start of the weeks and drops to about 65% and 73%. The Work from Home instruction (illustrated with dashed blue line) came into effect for the week commencing March 16; during that week car volumes dropped slightly at the start of the week then rose mid-week to 120% then dropped to 50% at the weekend. Pedestrian volumes dropped at the start of the week from just over 70% to 60% then dropped further during the week to 25% by the weekend. For both cars and pedestrians there was a slight rise at the start of the next week to 70% for cars, and about 37% for pedestrians. Lockdown was then imposed on March 23 (illustrated with a dashed red line) and volumes declined to just over 30% for cars and 20% for pedestrians by the end to the week. From 30 March to 20 April car volumes have been between approximately 60% and 40%, with a jump at the start of the week of 20 April to 80%, coming back down to around 70%. Pedestrian levels have remained between 20% and 30% up to 27 April.

Source: UBDC, Glasgow Centre for Population Health and Glasgow City Council. Permission to use data for this purpose granted by Glasgow City Council. Data plottted by UBDC. Not to be reproduced without permission.

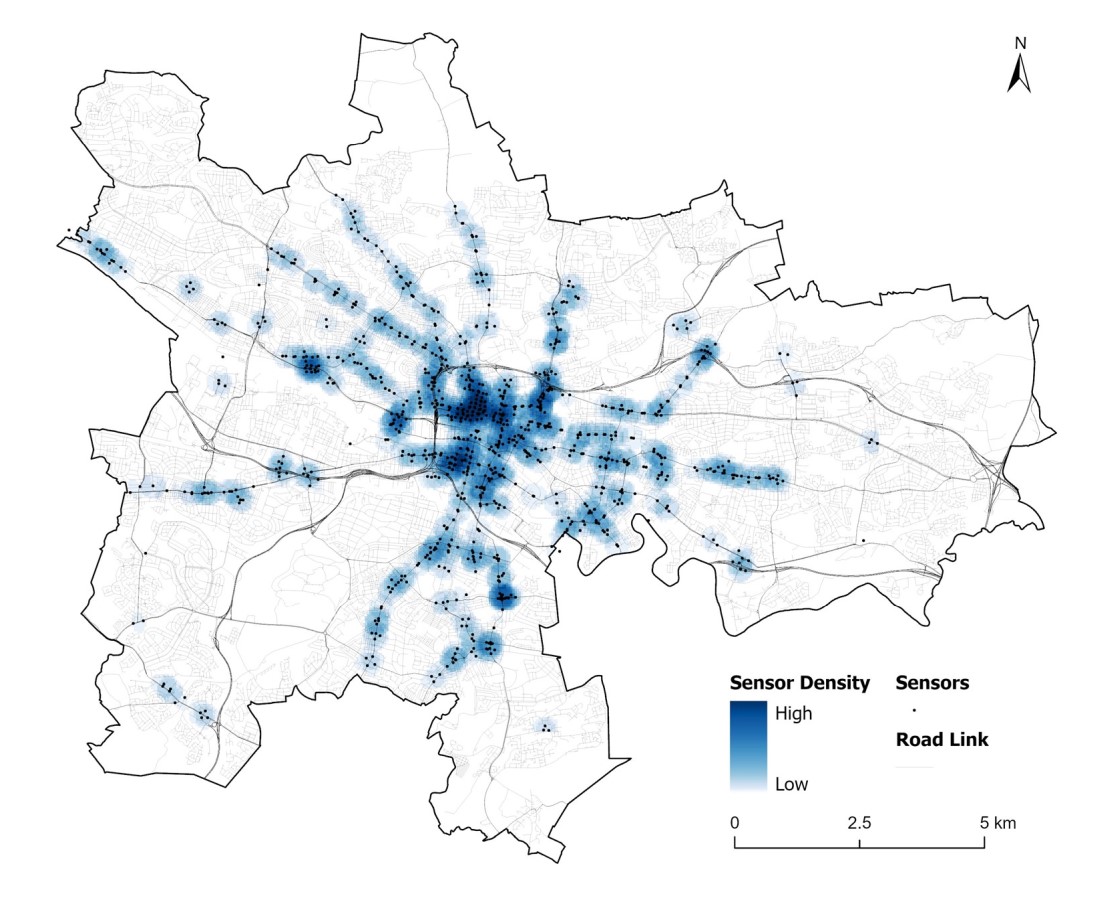
Data from sixty traffic sensors (SCOOT loops) around Glasgow also shows a sharp drop in traffic on the roads.

Graph showing relative traffic flows detected by SCOOT loops. The y axis shows relative traffic flow going up from 0 to 25, to 50 and 100. The Y axis shows months, starting with February 2020 and including March and April. Traffic flows are around or above 100 until about the second week in-March when there is a drop to about 90 from about 110. There's a small revival but then a steep decline to about 70 when lockdown was imposed in last March – illustrated by a vertical dashed red line. There’s a further drop to about 55 where the rate largely stays with two small spikes to around or just above 60 just before and just after the start of April. Flow then remains between 50 and the low 60s until rising again to about 70 at the very end of April.

Source: Open API operated by Glasgow City Council. Data processed and plotted by UBDC.

Urban economies are also marked by their external connections, and transport flows in and out of airports have been substantially impacted. As the COVID-19 outbreak took hold, Edinburgh airport notably mentioned going months without passengers; indeed recently released data (March) from the Civil Aviation Authority on passenger movements at the airport show sharp declines. The state of the aviation industry that emerges from the lockdown, and how airports such as Glasgow and Edinburgh fare in sustaining routes to key commercial locations (domestically and internationally) among other places, will no doubt be important for the City Region’s economic recovery.

An interesting question for considering the trajectories of the urban economy is the use of air pollution data. It has been widely reported, from many contexts, that air pollution has fallen as a result of lockdown measures.

Collection of 36 graphs from urban locations around the UK which show the mean NOx levels (log) 8am to 8pm, unadjusted (dashed line) and adjusted (plain line) for windspeed.  The y axis shows the levels. The ranges vary for location which vary for location with lowest start level being 3% and the highest being 300%.  The x axis shows weeks from 2 March to 13 April 2020. Each is graph is bisected by two vertical dashed lines showing the ‘work at home’ and ‘lockdown’ dates. The locations are:  Belfast Stockman’s Lane; Birmingham A4540 Roadside; Birmingham Alcocks Green; Birmingha Ladywood; Bristol St Paul’s; Bristol Temple Way; Cardiff Centre; Cardiff Newport Road; Edinburgh Nicholson Street; Edinburgh St Leonards; Glasgow Great Western Road; Glasgow High Street; Glasgow Kerbside; Glasgow Townhead: Leeds Centre; Leeds Headingly Kerbside; Liverpool Speke; London Bexley; London Harlington; London Hillingdon; London Marylebone Road; London N. Kensington; London Westminster; Manchester Picadilly; Manchester Sharston; Newcastle Centre; Newcastle Cradlewell Roadside; Nottingham Centre; Nottingham Western Boulevard; Salford Eccles; Sheffield Barnesley Road; Sheffield Devonshire Green; Sheffield Tinsley. Almost all the graphs show a small decline before the work at home date followed by steeper declines after lockdown, with the exception of some London locations and Liverpool Speke which stay almost level. The majority of the London locations show much less of a decline than the other locations.

Source: UK AURN, using ‘openair’ package (http://davidcarslaw.github.io/openair/) and produced by Nick Bailey, UBDC

On the one hand, air pollution data gives us a lens to consider the resumption of activity (is activity getting back to the way it was, in essence?). However, this is different from the normative question of whether we should hope to see the levels of pollution we were once seeing. If we are interested, indeed, in liveable cities, air pollution reflects a critical issue. Broader debates emerging about the need for a green stimulus to support the COVID-19 response come in here.

In summary, the Glasgow City Region economy is an important lens to consider the impacts of the COVID-19 lockdown and recovery. It is a context that exhibits challenges both inter- and intra-regionally. If the UK Government and the Scottish Government seek to advance a ‘levelling up’ agenda, policies to address the needs of different places will be required as we pull through this crisis. To inform these responses, we may usefully develop richer local data.

This blog was originally published on the Policy Scotland website.


Leave a comment. Please refer to our Comments Policy before posting.

Your comment

JOINTLY FUNDED BY