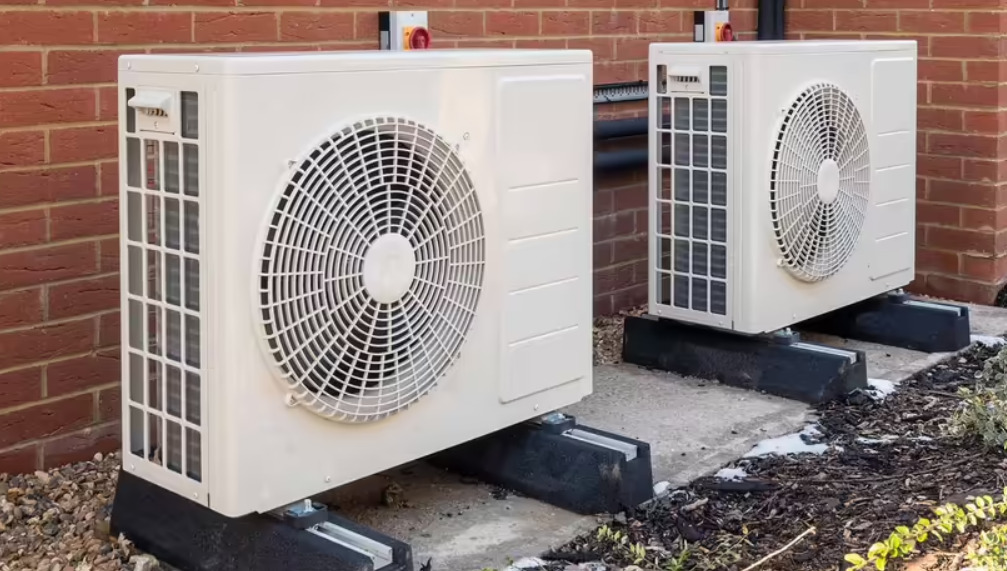
How many heat pumps?

UBDC Director Nick Bailey responds to The Climate Change Committee downgrading the estimate of progress with the installation of heat pumps:
The Climate Change Committee (CCC) today (19 July) put out its annual Report to Parliament on progress towards Net Zero, noting that the UK is not on course and urging more rapid action from Government.[1]In amongst the plethora of statistics, it downgraded its estimate of progress with the installation of heat pumps – the key measure required for decarbonisation of domestic energy consumption.
Two years ago, the CCC bemoaned the lack of good data for this critical indicator:
“An official, transparent and publicly available dataset on heat pump installations is required to properly track progress in this critical area.”[2](Climate Change Committee 2022 – Mitigation Monitoring Framework)
In their last progress report, they relied on estimates from a private consultancy[3],suggesting the UK installed 72,000 heat pumps in 2022, of which 69,000 were in domestic properties. That figure was subsequently quoted by the Parliamentary Office for Science and Technology (POST) in its 2023 briefing for MPs.[4]
In the CCC’s latest report, however, they switch to quoting figures from an industry body, the Heat Pump Association. Now the 2022estimate is 57,900 – a reduction of almost 20% on the previous figure. Even that clearly overstates the number of domestic installations since it includes commercial applications.[5]Coming from an industry body, we might also regard the figures as upper limits, especially given the reliance on a certain amount of estimation to fill in gaps in their market knowledge. And they are clearly neither official nor transparent.
One alternative source is data from the Microgeneration Certification Scheme (MCS). MCS sets standards for heat pump installations and certifies these, to try to give consumers more confidence and incentivise higher quality on the supply side. Not every installation will be certified but MCS have recently launched a handy dashboard (https://datadashboard.mcscertified.com/)to provide access to their data. Their estimate for 2022 is considerably lower than the Heat Pump Association’s, at 32,900, of which 30,700 were domestic.
A second alternative is the data contained within Energy Performance Certificates (EPCs). Again, this is likely to be quite incomplete. Some Government funding schemes require owners to get an EPC as a condition of receiving a grant but many installations will not be accompanied by survey. Still the EPC data are openly available. For inspections conducted in 2022, the EPC total for domestic properties is 30,300 – very close to the MCS total.
Both MCS and EPC provide heat pump numbers in each local authority area. Overall, there is strong agreement between them as Figure 1shows. But there are also places where they produce very divergent counts. In Westminster, MCS has just 44 installations but EPC records 1303 properties with heat pumps. Elsewhere, MCS has a far higher number: in Powys, for example, MCS record 2352 installations compared with an EPC total of just 897.
Figure 1: Heat pump numbers by local authority – EPC vs MCS

One solution is to combine the two sources: for each local authority in each year, we take the higher of the figures reported by MCS and EPC. This is still a minimum estimate of heat pump numbers as there will be cases missed by both, but it should be more complete than either one on its own.
Figure 2 shows the results, with annual totals from MCS and EPC separately and for the two combined. It also shows the estimates from the Heat Pump Association which the CCC relies on. While the direction of travel is similar in each case, the absolute scale is very different. Even the combined MCS/EPC estimate is a third lower than the figure produced by the Heat Pump Association. That is a very large margin of uncertainty.
Figure 2: Estimates of annual heat pump installations

None of these estimates changes the fundamental picture: the UK is clearly falling woefully short of the levels of progress required to meet climate change targets. Other countries are making much greater progress, including Netherlands and France, and there is much we should be learning from them.[6]But as time goes on, an accurate estimate of progress will become ever more important. We urgently need a measure which policy makers can rely on – one which meets the CCC’s requirements of being “official, transparent and publicly available”.
[1] https://www.theccc.org.uk/wp-content/uploads/2024/07/Progress-in-reducing-emissions-2024-Report-to-Parliament-Web.pdf
[2] https://www.theccc.org.uk/publication/ccc-monitoringframework/?chapter=3-buildings#indicators
[3] https://www.theccc.org.uk/publication/2023-progress-report-to-parliament/, p145
[4] https://post.parliament.uk/research-briefings/post-pn-0699/, p6
[5] https://www.heatpumps.org.uk/resources/statistics/
[6] https://www.theccc.org.uk/wp-content/uploads/2024/07/Progress-in-reducing-emissions-2024-Report-to-Parliament-Web.pdf, Box 3.2
Files
Latest news

IDEAMAPS network launches new platform
The IDEAMAPS Network launches its Data Ecosystem platform - a new digital mapping tool to support improvements in deprived areas in Low- and Middle-Income countries.
%201.svg)

UBDC team wins a top award at the ACM SIGSPATIAL conference
Researchers examined the 'Optimal Minimum Deployment of Electric Vehicle Charging Station Networks'.
%201.svg)

Indoor environment and energy use study
UBDC - in collaboration with Understanding Society, the UK Household Longitudinal Study - is launching a new study to provide linked-data on energy usage and indoor environment.
%201.svg)
Jointly funded by
%20copy.png)
.png)


.svg)
.svg)


